Pearson Edexcel · GCSE · Mathematics
Course version: 1MA1 · Version from Mar 2026
Infer properties of populations or distributions from a sample, while…
Full specification wording
Statistics: infer properties of populations or distributions from a sample, while knowing the limitations of sampling
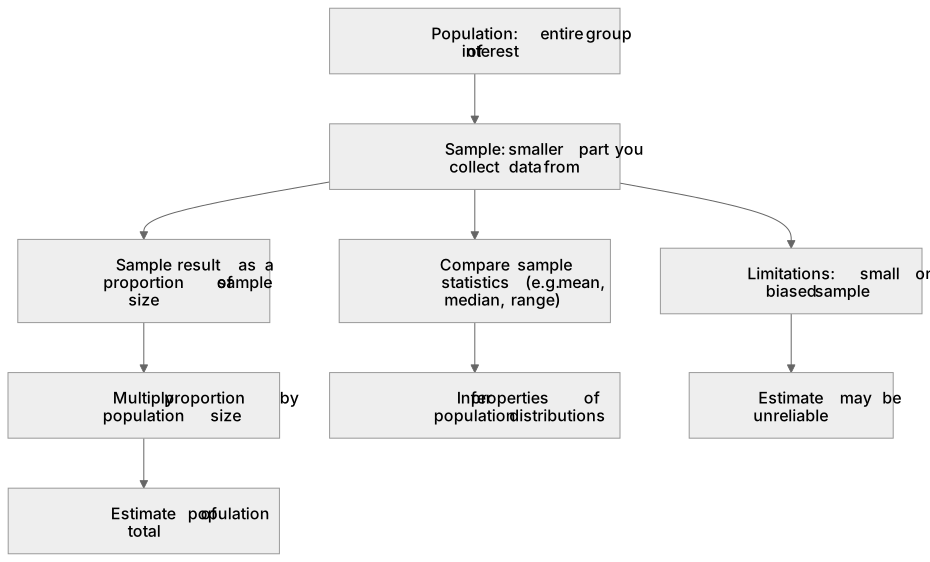
A population is the entire group of interest (e.g., all shoppers at a supermarket), while a sample is a smaller part you collect data from.
Checked against the Pearson Edexcel 1MA1 specification (opens in a new tab) on .
- Point 1 of 7
- 4 key terms
Study notes
From the checked teaching notes for this specification point.
The idea
A population is the entire group of interest (e.g., all shoppers at a supermarket), while a sample is a smaller part you collect data from. We sample because measuring the whole population is often impractical. From a sample, we can infer properties of the population. This includes estimating totals: if 12 of 50 shoppers (24%) buy fruit, we estimate that 0.24 × 8000 = 1920 of the 8000 total shoppers will. We can also infer properties of distributions: if the median exam score of a sample from School A is higher than a sample from School B, we infer School A's students tend to have higher scores. However, inferences are limited by the sample. A small or biased sample (e.g., taken at one time of day) may not be representative, making the estimate unreliable.
What earns the marks
- Writing the sample result as a fraction or proportion of the sample size.
- Multiplying that proportion by the stated population size to get an estimate.
- A valid comparison of sample statistics (e.g., mean, median, range) to make an inference about populations.
- A reason for unreliability related to sample size, bias, or timing, explaining its potential effect.
Common mistakes and how to put them right
Giving the raw sample count as the population estimate.
Scaling with the wrong pair of numbers, such as dividing population size by the sample result.
Stating that a sample proves a population property, rather than suggesting it is an estimate or inference.
Exam tips
- For scaling questions, find the proportion first (sample result ÷ sample size), then multiply by the population size.
- When comparing distributions, use comparative language like 'tends to be higher' or 'shows more variation', acknowledging it's an inference from a sample.
- For a limitation, name who or what the sample excluded and suggest how this could affect the result.
Try the lesson
The start of the Statistics: infer properties of populations or distributions from a sample, while knowing the limitations of sampling lesson, made from checked teaching notes for this specification point.
Have a go first
A researcher measures the heights of 50 people chosen at random from a town of 20 000 people. The mean height of the sample is 168 cm. Which statement is the most reasonable inference about the town's population?
Listen
A population is the entire group of interest (e.g., all shoppers at a supermarket), while a sample is a smaller part you collect data from. We sample because measuring the whole population is often impractical. From a sample, we can infer properties of the population. This includes estimating totals: if 12 of 50 shoppers (24%) buy fruit, we estimate that 0.24 × 8000 = 1920 of the 8000 total shoppers will. We can also infer properties of distributions: if the median exam score of a sample from School A is higher than a sample from School B, we infer School A's students tend to have higher scores. However, inferences are limited by the sample. A small or biased sample (e.g., taken at one time of day) may not be representative, making the estimate unreliable. A strong answer earns marks for these points. writing the sample result as a fraction or proportion of the sample size. multiplying that proportion by the stated population size to get an estimate. a valid comparison of sample statistics (e.g., mean, median, range) to make an inference about populations. a reason for unreliability related to sample size, bias, or timing, explaining its potential effect. Exam tip: For scaling questions, find the proportion first (sample result ÷ sample size), then multiply by the population size.
See it
Key words
Say what each word means before you turn the card.
population
Try answering aloud or in your head before turning the card.
sample
Try answering aloud or in your head before turning the card.
inference
Try answering aloud or in your head before turning the card.
bias
Try answering aloud or in your head before turning the card.
See every definition
- population
- The entire group of interest, such as all shoppers at a supermarket, from which a sample is taken.
- sample
- A smaller part of a population that you collect data from.
- inference
- A conclusion about properties of a population or distribution drawn from a sample, which is an estimate rather than proof.
- bias
- A feature of a sample, such as being taken at one time of day, that may make it not representative and the estimate unreliable.
Label the diagram
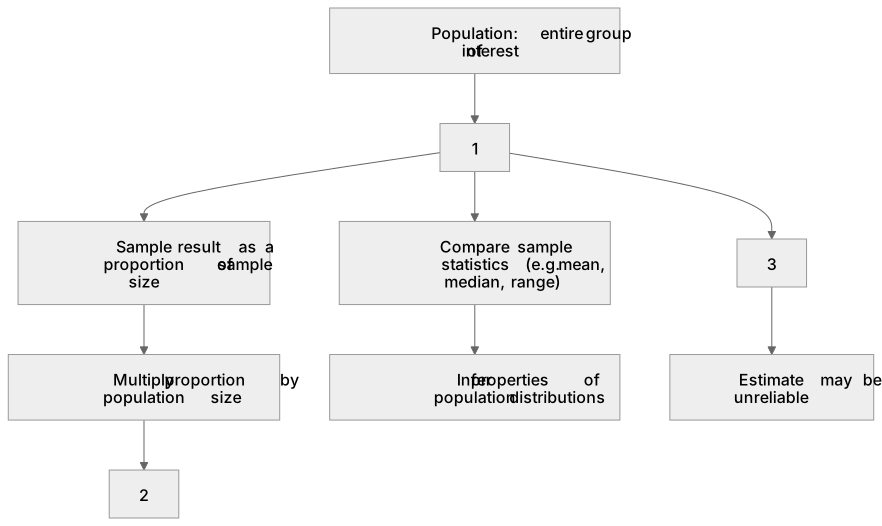
Some boxes have lost their names. Pick the right name for each number.
1Box 1
2Box 2
3Box 3
There is more to this lesson
The full lesson goes on to check your understanding and help you earn the marks. Create a free account to carry on, with your progress saved.
A week of Premium from your first lesson · Then the free plan continues · No card, no charge
Test your understanding of Statistics: infer properties of populations or distributions from a sample, while knowing the limitations of sampling
Active recall beats re-reading. Take an instant quiz now to test what you’ve learned and lock it into long-term memory.
A week of Premium from your first lesson · Then the free plan continues · No card, no charge